We recently analyzed 3.25 billion website visits to find out:
- What are the main traffic sources for the world’s biggest websites?
- How much do different industries rely on Google and Facebook?
- Which social media networks send the most web traffic?
And more.
This report is filled with information that should be useful to anyone who competes for traffic online. Thanks to SimilarWeb for their data, which made this analysis possible.
Now let’s see the study results.
Top Takeaways and Stats
1. Search is the single largest online traffic source, driving well over 50% of most industries’ web traffic.
2. Google drives 8 times more traffic than all social media networks combined.
3. The average top blog gets 66.47% of its traffic from search, of which 99.77% is organic and only 0.23% is paid.
4. In almost every industry, Facebook still sends more traffic than all other social networks. The two exceptions are Design and Development (for which the top network is YouTube) and Crypto (for which it is Twitter).
5. The niche that is most reliant on Google is Health and Medical, with 87.85% of its traffic coming from search.
6. The niche that is least reliant on Google is Crypto, with 45.74% of its traffic coming from search.
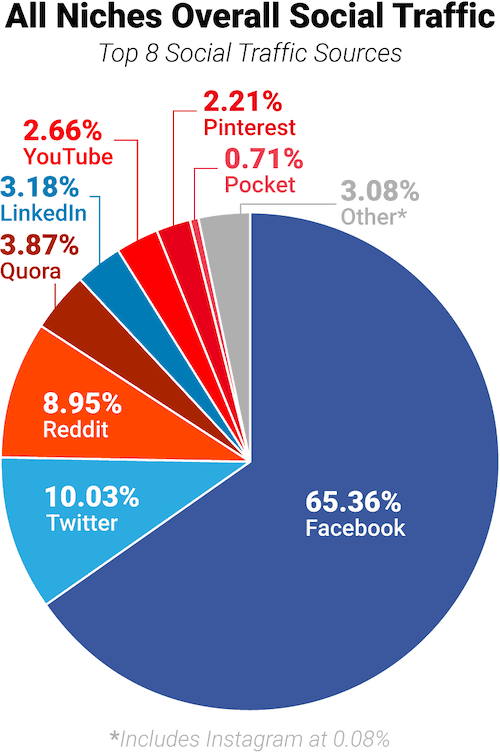
7. Facebook delivers 65.36% of all social media traffic: more visits per month than all other social networks combined.
8. Instagram drives very little traffic: under 1% overall across all niches. Even fashion and beauty brands that were launched by Instagram influencers (e.g. Kylie Cosmetics) receive less than 5% of their monthly visits from Instagram — while search brings in about 10 times as many.
9. The niche that is most reliant on Facebook is Business and Marketing, which gets 13.52% of its traffic from the network.
10. Reddit drives over 3 times as much traffic to blogs as YouTube.
Keep reading for more details and charts, or click here to download the full report for future reference.
Contents:
- How Much Do Different Niches Rely on Google?
- What Are the Most Important Social Networks for Each Niche?
- What Are the Top Website Traffic Sources for Each Niche?
- What Are All the Traffic Sources Overall, Across All 12 Niches?
- Details by Niche
- Study Method
How Much Do Different Niches Rely on Google?
Since over 90% of searches happen on Google, we can see how reliant on (or vulnerable to) Google different sites are by looking at how much of their traffic comes from search.
In the “Details by Niche” section in this report, you’ll also be able to see this information for each individual site we studied.
But right now, let’s take a bird’s-eye view and compare the data by industry.
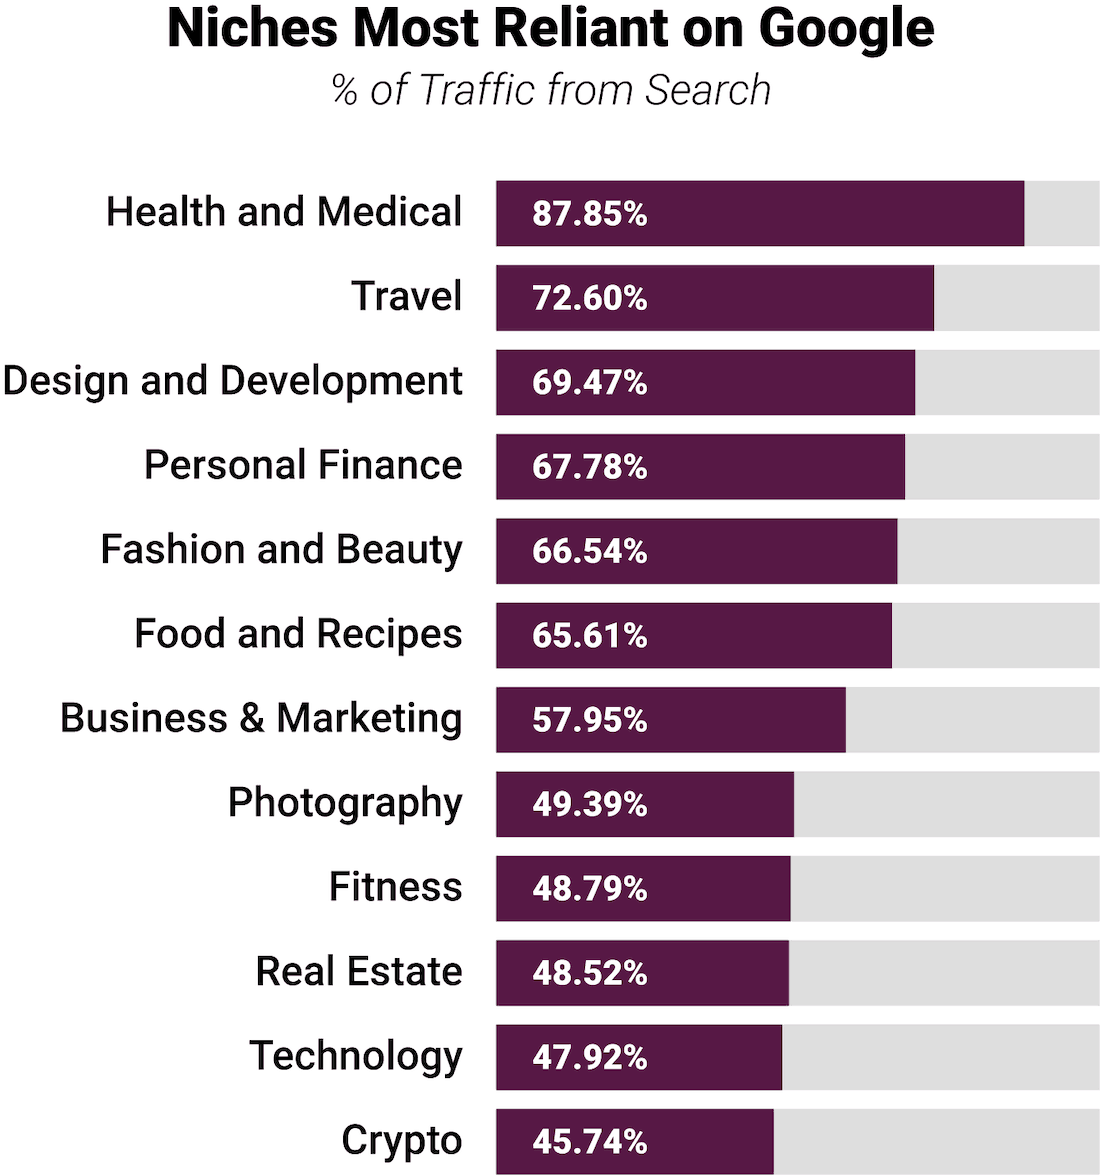
As you can see, the range goes all the way from 45.74% to 87.85%, with most niches getting over half their traffic from search.
Depending on the industry, this may represent a big opportunity or a big risk.
Search is the biggest driver of traffic across the entire Internet — if you don’t take advantage of that, you’re surely leaving money on the table.
But at the same time, Google has continually kept more and more of its traffic for itself, with less than half of Google searches now resulting in clicks through to other websites.
So if you over-rely on Google, you may be building your business on quicksand.
Expert reaction:
“The contrarian advice good SEOs typically give is ‘Don’t rely on SEO. Diversify your traffic sources.’ The verticals most dependent on Google search are the most vulnerable. And indeed, we’ve seen both medical and travel sites exposed to huge business risks this year as Google has targeted dozens of medical sites, and made bolder plays with their own flight and hotel offerings.
Also interesting to note that the sites with the largest dependency on search are also in verticals where Google has the easiest time answering questions. Apparently, Google isn’t too good yet at answering crypto or real estate queries. But if I were in those industries, I’d keep one eye looking back over my shoulder.”
– Cyrus Shepard, Founder, Zyppy.com

What Are the Most Important Social Networks for Each Niche?
Like search, social networks offer a lot of opportunity for sites to grow their traffic.
Also like search, social networks can present a lot of risk.
For example, Facebook is now directly competing against the dating sites that used to spend millions on Facebook Ads (and were also gradually squeezed out of using them due to Facebook’s stricter rules for that industry).
More broadly, Facebook has continually reduced brands’ reach with their own followers, forcing them to either pay for advertising or lose most of their visibility.
And faster-growing social networks like Instagram, Snapchat and TikTok are designed from the ground up in a way that makes it difficult to drive traffic to external sites.
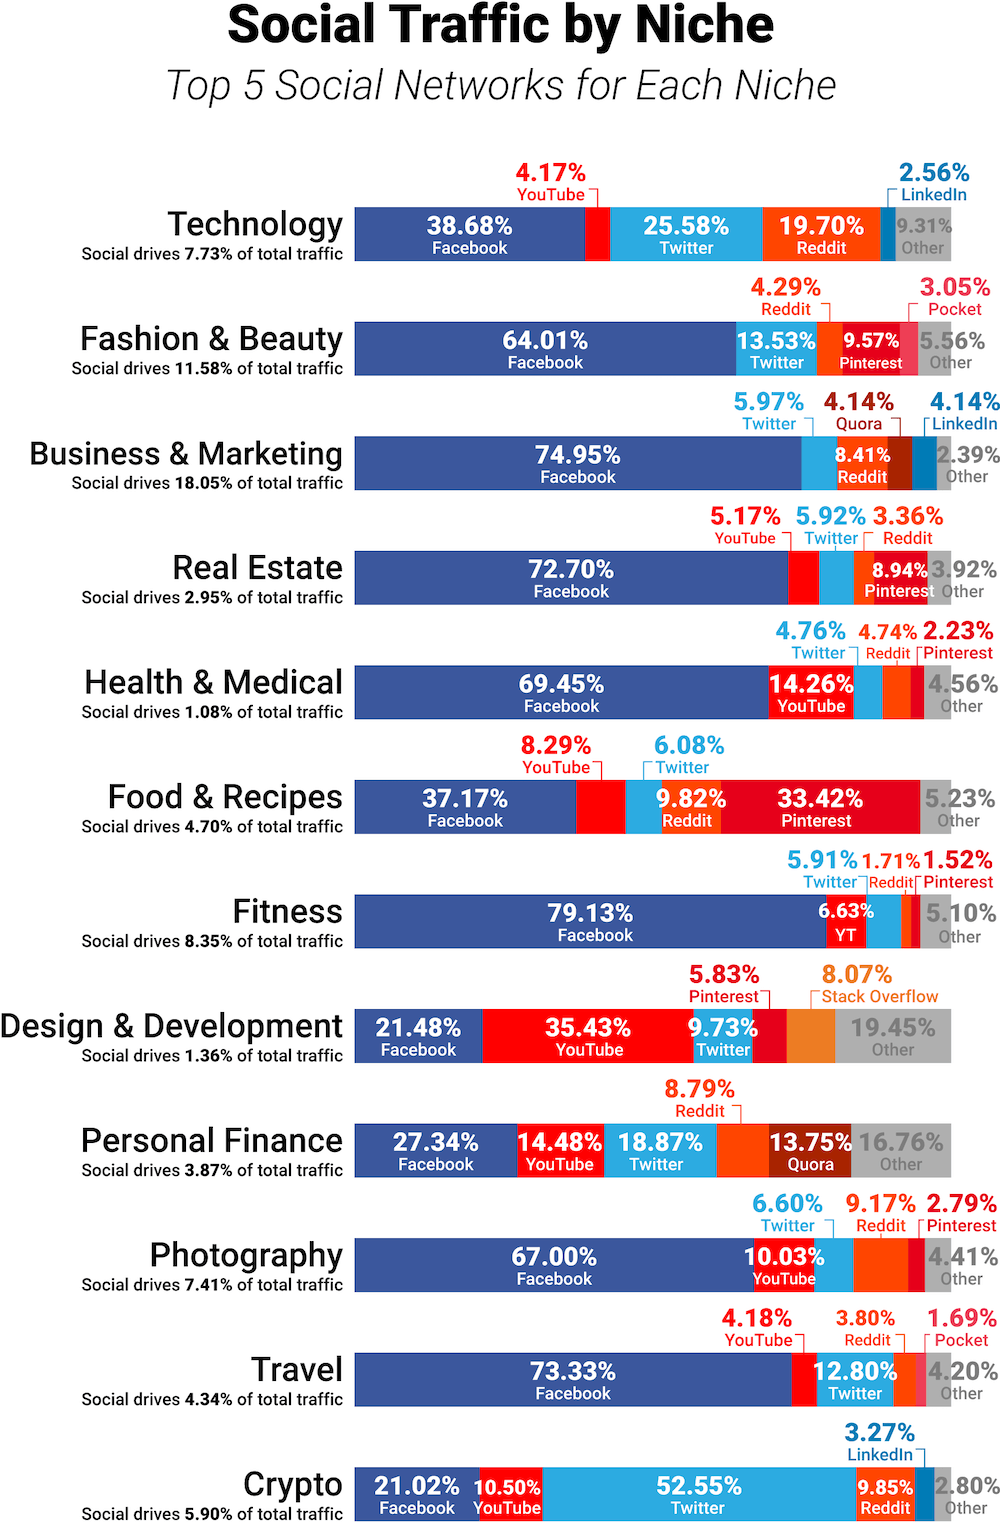
As a result, as you can see below, none of those three make it into the top 5 social networks for any niche in this study:
Expert reaction:
“Instagram started to become hugely popular with marketers around 2016, mostly because it had become so popular with users, but also because its newsfeed algorithm at the time was very engagement-friendly for brands.
Today the platform is experimenting with killing publicly viewable like counts on posts, which I’m sure has some sound business reasoning behind it, but on the surface, this change reads like a move away from vanity metrics. Of course, if you’re going to focus on the true business value that a social network has to offer to marketers, traffic referrals will be a key aspect of that. But Instagram has very few spots where marketers can post clickable links – it’s basically just inside stories and bios.
So it’s interesting to see a list of top performing social networks – especially one that includes vertical-specific data on travel, photography, fashion and food, all of which are especially huge on Instagram – and for Instagram to not appear at all. The reason for this is obviously the lack of clickthroughs from Instagram to websites, which is what this list measures, but what are marketers to learn from the elephant in the room?
Does Instagram’s omission suggest that we might do well to consider de-emphasizing Instagram as a marketing channel? Should we maybe stop thinking about traffic referrals as being such an important metric?
These are hardly new questions – fears over the dangers of ‘digital sharecropping’ on Facebook proved to be well founded when organic reach for publishers was basically killed altogether a few years back. But seeing all this data in context definitely gives us a good excuse to reevaluate objectives and emphases.“
– Ben Jacobson, Marketing Strategy Consultant

What Are the Most Important Social Networks, Overall?
Here is the average breakdown of the top 8 social networks across all niches overall (again, note the absences of Instagram, Snapchat and TikTok):
Interestingly, StatCounter’s worldwide data (across all types of sites) over the same period shows Pinterest with a much higher share of social traffic, at 15.5%.
This may indicate that Pinterest works better for sites that aren’t as reliant on blogging, or for industries that weren’t covered in this study (for example, reference sites and news publications).
What Are the Top Website Traffic Sources for Each Niche?
As I mentioned earlier, search is the #1 source of traffic for every single niche in this study. And that really means Google, thanks to its 90%+ search market share.
In fact, Google drives over 8 times more traffic to the sites in this study than all social media networks combined. As a content distribution channel, it’s practically unbeatable.
But some industries do rely more on social media and other traffic sources than others, as you can see here:
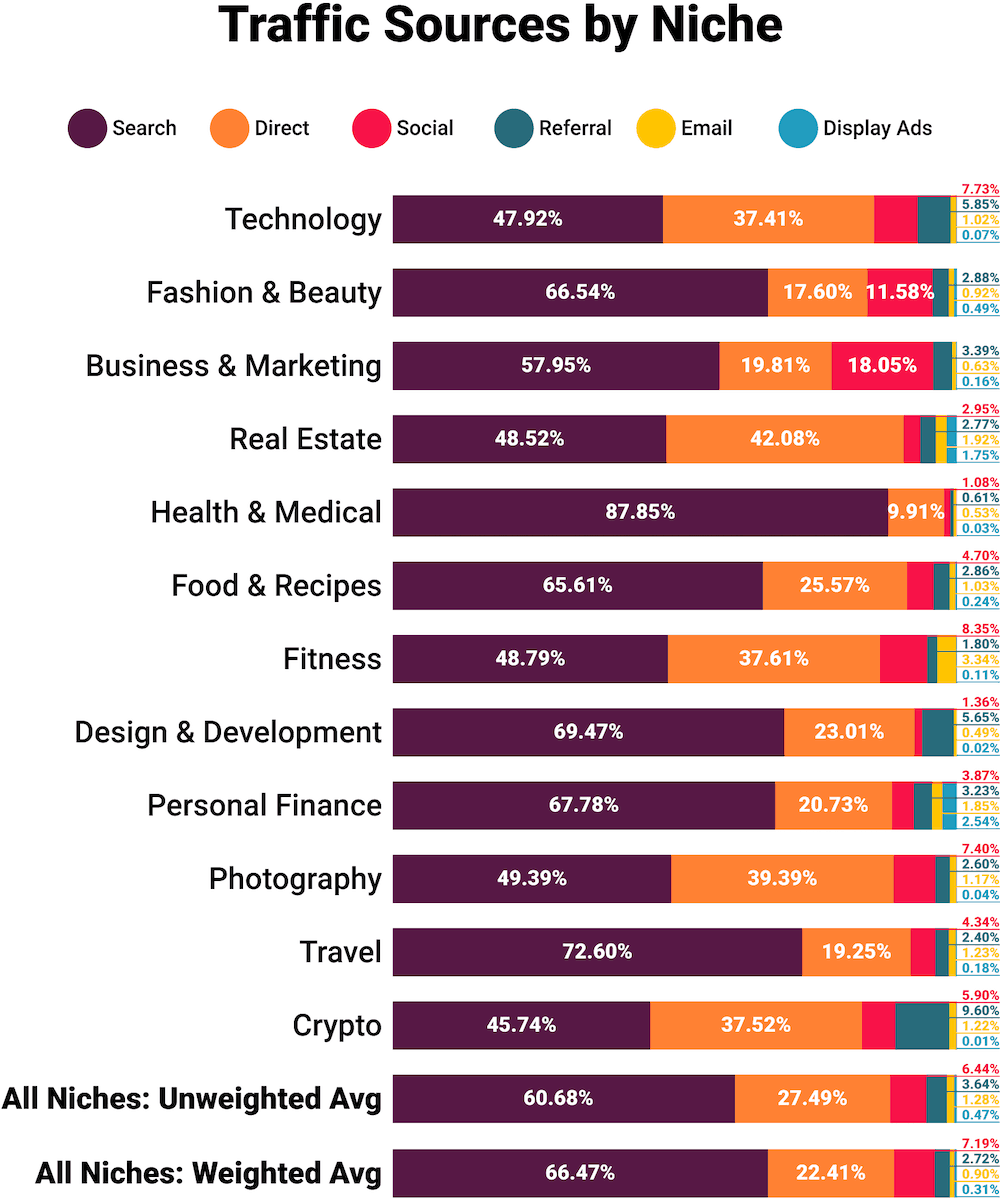
For social media reliance, Business and Marketing tops the charts with 18.05% of its traffic coming from social networks — followed by 11.58% for Fashion and Beauty.
At the other end of the spectrum, Health and Medical gets only 1.08% of its traffic from social, while for Design and Development it is 1.36%.
That seems to make sense: how often do you talk about your medical issues on social media?
However, I would have expected higher proportions of social traffic for Personal Finance (which is 3.87%) and Travel (4.34%). There seems to be a lot of viral content in those niches, leading me to believe that social traffic is an important part of their content marketing funnels. But apparently that isn’t the case.
I’m also surprised that Real Estate doesn’t get more of its traffic from search: out of all the niches, it has the highest percentage of Direct traffic at 42.08%.
Although “Direct” may also include other untracked traffic sources, to me this still indicates that Real Estate has some of the strongest brands and is one of the least susceptible to algorithm changes or competition from Google or Facebook (or other social networks).
Expert reactions:
“Regardless of niche, search still has a pivotal role to play. This is, of course, more prevalent in sectors like healthcare where “Dr Google” is a source of health advice to millions of us. While social does contribute to traffic profiles, it remains a small part for many of the biggest blogs in these niches.
I think, on the whole, what the graph highlights is how over reliant we could potentially become on one single traffic source. I’m an SEO, so I’m always going to lean on search to drive traffic. But as a website owner or small business owner, I’d much rather see traffic (and enquiries) coming from multiple varied sources. I think it’s a good practice for every website owner to analyse their traffic sources, produce graphs like this and look to diversify their traffic sources.“
– Stacey MacNaught, Founder, MacNaught Digital
“I’m fascinated by the break-down of traffic sources Health & Medical. The 87.85% contribution from search must be due to ‘Doctor Google,’ whereby people enter their symptoms in the search engine to receive medical advice or diagnoses.
Adding direct traffic to search comes to 97.76%, leaving virtually no share to the remaining traffic sources. I’m really surprised that social and referral barely register. For me, this signals opportunities.“
– Dennis Shiao, Marketing Consultant


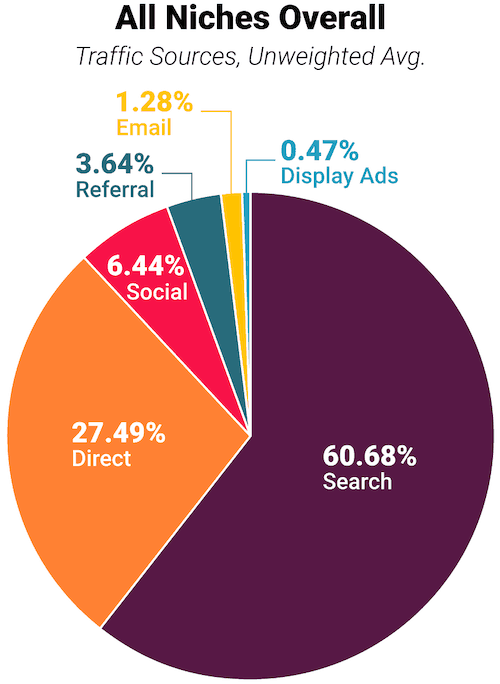
What Is the Overall Breakdown of Traffic Sources, Across All 12 Niches?
And here is a closer look at the overall averages across all 12 niches.
Expert reaction:
“The dominance of search as a traffic source is not surprising, and it proves that search is still overwhelmingly the most common way people navigate the web.
What did surprise me a bit was that direct traffic was so far ahead of the remaining sources (particularly social). I believe this is a testament to the continued importance of branding, and it’s why direct traffic and branded searches are two primary KPIs I track for Page One Power’s content marketing efforts.
With that said, search is clearly still the primary channel for digital marketing and you need to be optimizing for search if you have a website. In fact, improving search performance can actually have a positive impact on branding and lead to more direct traffic (searchers recalling your brand after encountering it over and over in search) as well.“
– Andrew Dennis, Senior Content Marketing Specialist at Page One Power

Details by Niche
Now it’s time to take a closer look at each of the 12 industries in this study individually.
These website traffic comparisons should help you plan or tweak your marketing strategy, help you come up with content marketing ideas, and more.
In the following sections, you’ll see traffic breakdowns for each niche as well as for each site within it.
Or if you want to download a PDF of this full study to read later, just click here.
- Technology
- Fashion and Beauty
- Business and Marketing
- Real Estate
- Health and Medical
- Food and Recipes
- Fitness
- Design and Development
- Personal Finance
- Photography
- Travel
- Cryptocurrency
Technology Blogs

The technology niche is an absolute monster.
The tech blogs covered here receive a combined 130 million visits per month: The Verge, Ars Technica, TechCrunch, Hacker Noon and GeekWire.
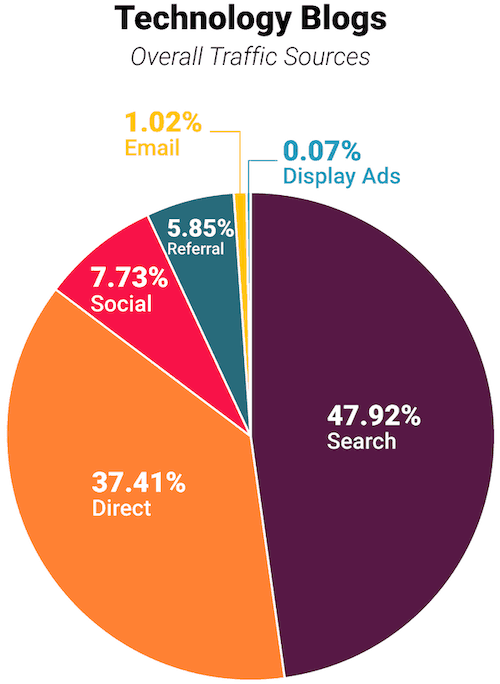
Overall traffic:
As a whole, sites in the technology niche:
- Rely on Google significantly less than average, with 47.92% of their traffic coming from search (vs. the all-niche average of 60.68%).
- Get more social media traffic than average, at 7.73% of their total traffic (vs. 6.44% for all niches).
- Get more referral traffic from other sites than average, at 5.85% (vs 3.64%)
But there’s massive variation between each individual site, as you’ll see shortly.
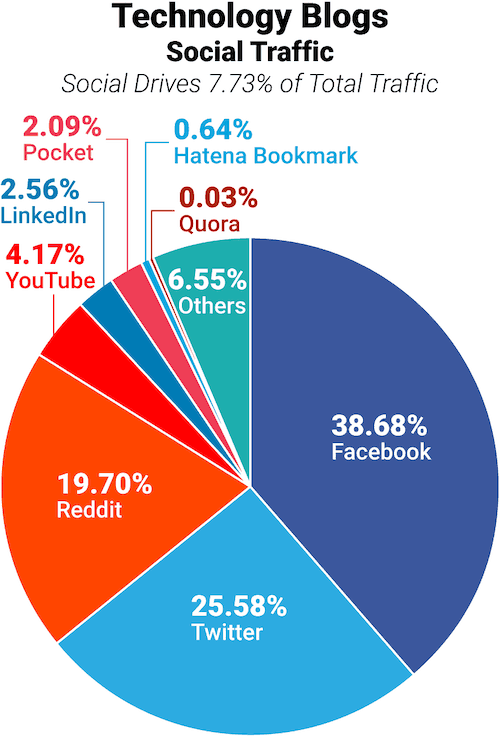
Social media traffic:
Although Facebook is the #1 source of social media traffic for tech blogs, at 38.68% of its social traffic it is a more minor contributor here than it is for most niches (the all-niche average for Facebook is 65.36%).
On the other hand, tech blogs get more than twice as much of their traffic from Twitter and Reddit as most blogs do, and their traffic from YouTube is significantly above average as well.
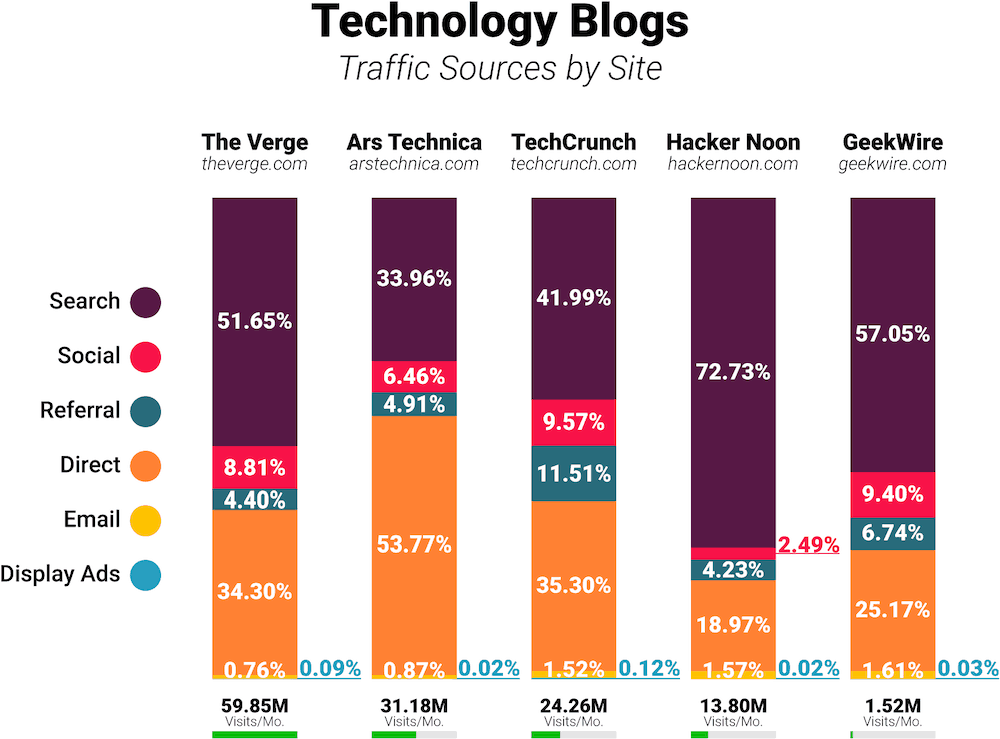
Traffic sources by site:
It’s always interesting to see how much variation there is between individual websites.
Of this group, Ars Technica is the least reliant on Google — with only 33.96% of its traffic coming from search — while a full 72.73% of Hacker Noon’s traffic is search traffic.
Hacker Noon is also notable for how little of its traffic comes from social media. At 2.56%, that’s about a third of the average for this niche.
Fashion and Beauty Blogs

The data sample for the fashion and beauty niche includes Elle, Refinery29, GQ, StyleCraze, and Vogue.com. (But in a minute, we’ll also look at a few newer sites that were started by Instagram influencers.)
Those five sites receive 72 million visits per month, combined.
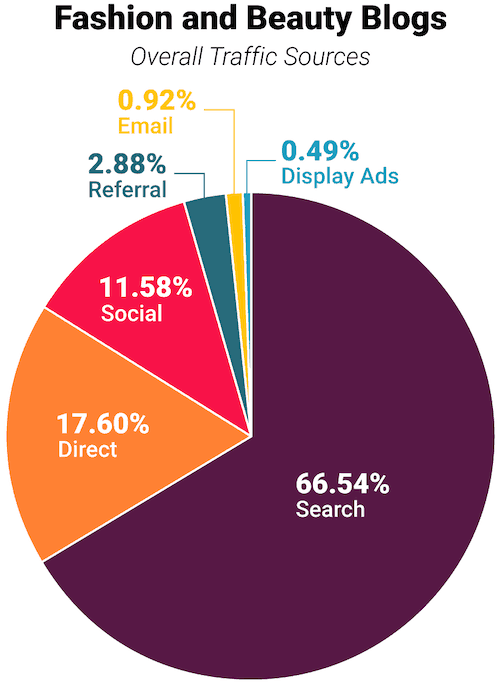
Overall traffic sources:
Compared to all-niche averages, sites in the fashion and beauty niche tend to:
- Rely more on search traffic, getting 66.54% of their traffic from search (compared to the all-niche average of 60.68%).
- Also rely more on social media, getting 11.58% of their traffic from social networks (compared to the all-niche average of 6.44%).
- Get significantly less direct traffic than most niches (17.60%, compared to the average of 27.49%).
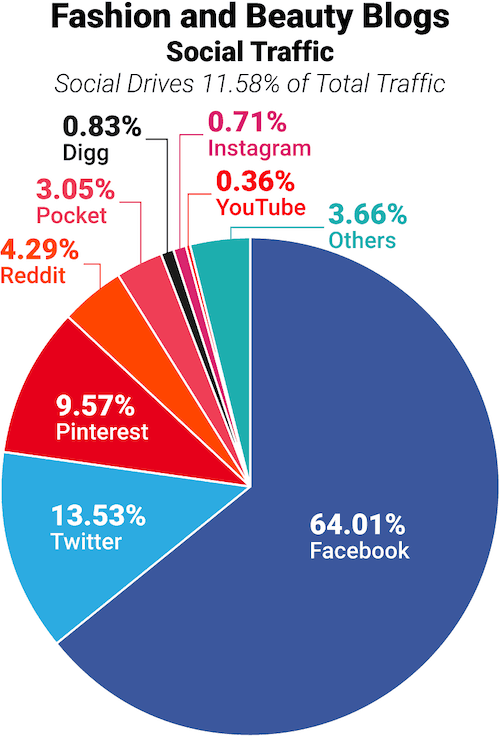
Social media traffic:
Pinterest is a big standout for the fashion and beauty industry, driving 9.57% of its social traffic.
On the other hand, compared to the all-niche average, Reddit only drives about half as much of this niche’s social traffic.
I was surprised in general at how little traffic Instagram contributes to this niche, since there are so many fashion and beauty brands that have been launched by Instagram influencers.
However, most of the sites included in these numbers are brands that were established long before Instagram became popular.
So even though they aren’t a formal part of this study (or included in these charts), I also investigated a few “Instagram-based” brands to see how different their numbers might be.
Let’s look at the social media chart for the five main sites first and then I’ll show you my findings for those other sites.
As I mentioned, I also looked at three smaller brands that were either launched on Instagram or are based on Instagram influencer personalities to see how much Instagram contributes to their overall traffic.
Here they are:
- Kylie Cosmetics (by Kylie Jenner) – 10.2% of total traffic from social, 46.51% of which is Instagram
- The Blonde Salad (by Chiara Ferragni) – 4.46% of total traffic from social, 32.82% of which is Instagram
- Good American (by Khloe Kardashian) – 11.22% of total traffic from social, 36.76% of which is Instagram
As you can see, Instagram is the top social media traffic source for all three of them…
But none of them gets more than 50% of their social traffic from Instagram.
And none of them gets more than 5% of their total traffic from Instagram.
Search, on the other hand, brings them about 10x – 47x as much traffic.
- Kylie Cosmetics – 45.50% of total traffic from search (vs 4.74% from Instagram)
- The Blonde Salad – 69.08% of total traffic from search (vs. 1.46% from Instagram)
- Good American – 55.21% of total traffic from search (vs. 4.12% from Instagram)
So even for these Instagram-focused outliers, the network only accounts for a very small portion of their traffic.
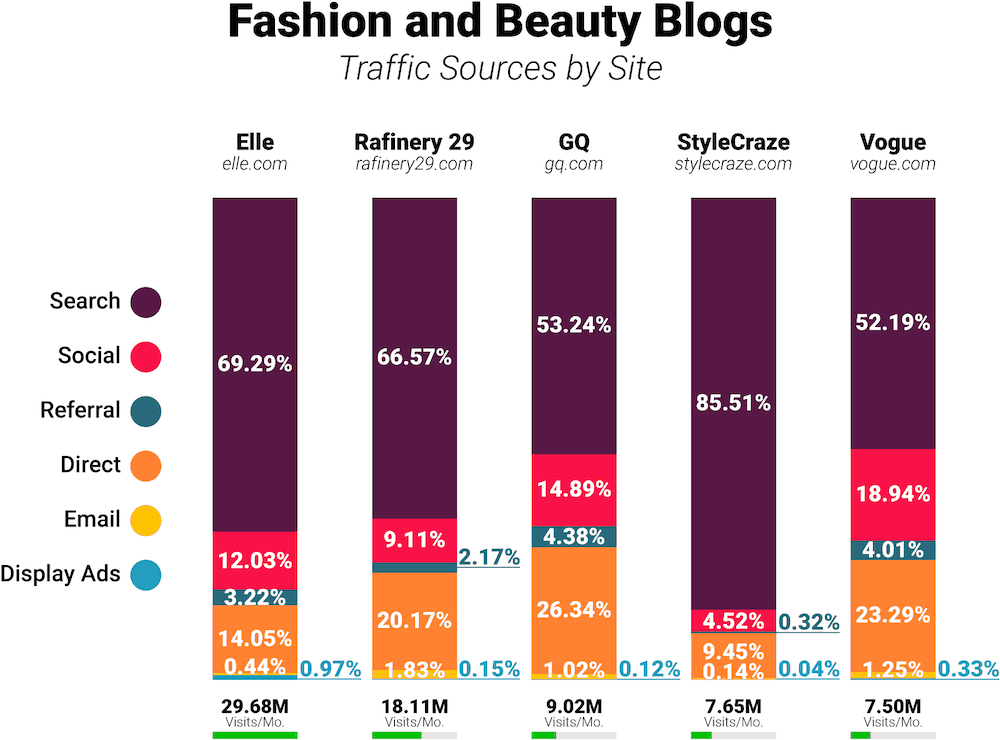
Traffic sources by site:
Back to those five main fashion and beauty sites, here’s how their traffic breaks down by site.
Business and Marketing Blogs
To analyze the business and marketing niche, I expanded my approach a bit.
First, I analyzed the top 5 blogs in the space like I’ve done for all the others, as you’ll see in a moment.
But many of the top marketing blogs belong to sites that operate primarily as marketing tools: Moz, Ahrefs, and Semrush, for example.
Those sites all have very strong blogs — but would be excluded from this study because so many of their visitors come to use their tools instead of to read their blogs.
(And they don’t use dedicated blog subdomains, which would allow me to isolate their blog traffic.)
So for this niche, I covered a set of 5 top “pure blogs,” but also broke out a set of 5 top “tool sites with blogs.”
Finally, as it’s a space I’m passionate about, I also created a third pie chart that combines the traffic data from the first 2 groups as well as a group of 5 more of the most popular marketing blogs, to form a group of 15.
However, note that for the comparison and “all niche” charts presented at the beginning of this report, the 5 “pure blog” sites were the ones used to represent this industry.
Now let’s check out the data.
Overall traffic:
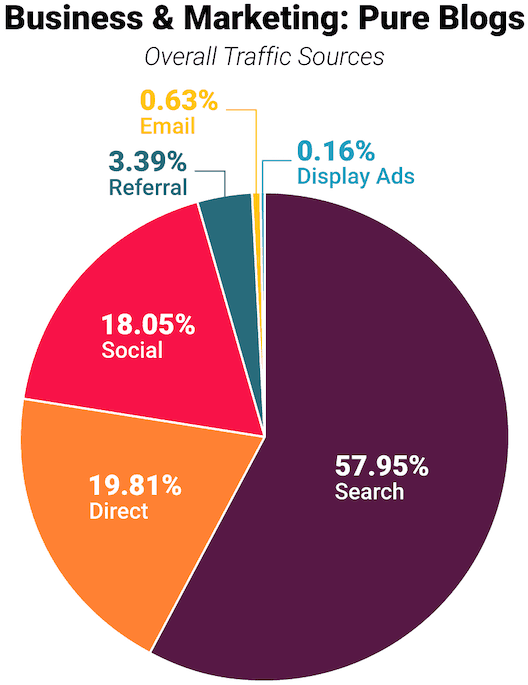
First, here are the traffic sources for 5 top business and marketing “pure blogs”: Business Insider, Mashable, HubSpot’s blog subdomain, Hootsuite’s blog subdomain, and Search Engine Journal.
Together these “pure blog” business and marketing sites get 232 million visits per month, consisting of:
- Slightly less search traffic than average, with 57.95% of their traffic coming from search (vs. the all-niche average of 60.68%).
- Much more social media traffic than average, at 18.05% of their total traffic (vs. 6.44% for all niches).
- Less direct traffic than average, at 19.81% (vs. the all-niche average of 27.49%).
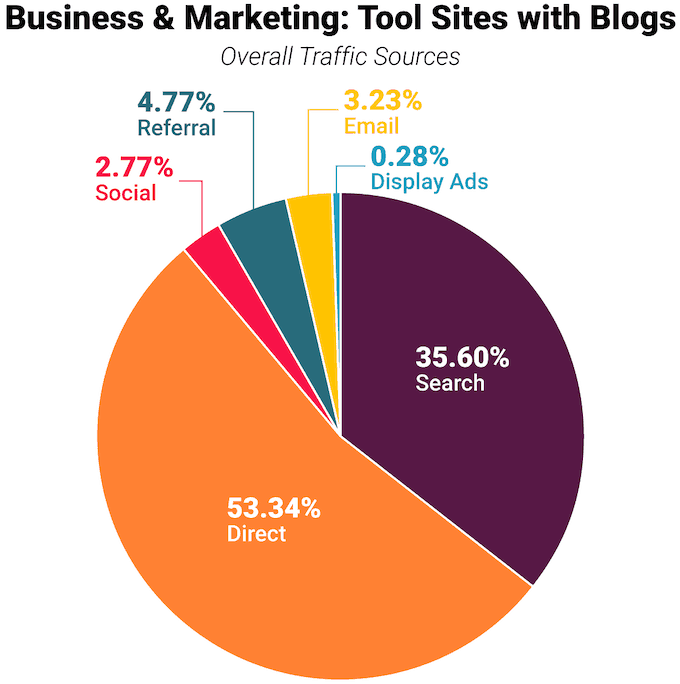
The 5 “tool” sites (Semrush, Ahrefs, Moz, Neil Patel, and Unbounce) get much more direct and email traffic than the “pure blogs” above, and much less from search and social media, as you can see below.
Another difference is their use of paid search advertising.
Throughout this traffic report, the charts I’ve presented do not break out organic search and paid search separately — because in almost every case the paid search accounts for under 0.10% of total traffic.
However, some of the marketing tool sites are an exception: Semrush gets 3.75% of its search traffic from paid search ads, for Moz it is 2.39%, and for Unbounce it is 1.95%.
Finally, for a combined view of the overall space here is a chart that includes the first 10 sites we just looked at as well as 5 of the next most popular marketing blogs: Social Media Examiner, Search Engine Land, Backlinko, QuickSprout, and Copyblogger.
As you can see, the following chart is much closer to the “pure blogs” chart than it is to the “tool sites” chart:
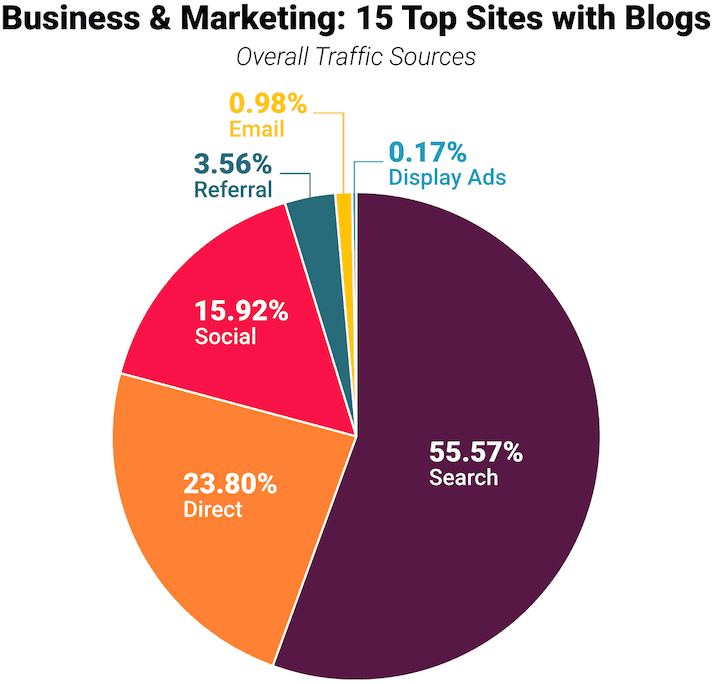
Note: the rest of the charts we’ll see for this niche will cover the first, “pure blogs” group alone.
Social media traffic:
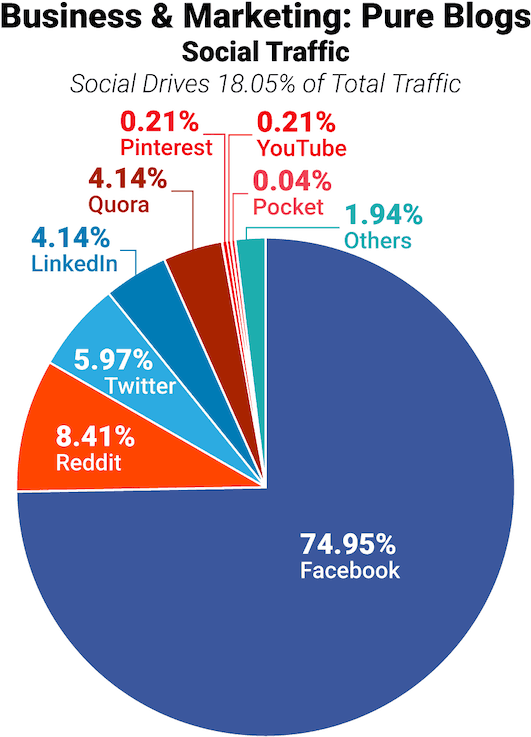
Comparing the business and marketing niche’s “pure blogs” social traffic to that of the all-niche averages, business and marketing gets:
- More traffic from Facebook, at 74.95% compared to the all-niche average of 65.36%
- About the same proportion of social traffic from Reddit and Quora as the all-niche average
- More traffic from LinkedIn, at 4.14% compared to the all-niche average of 3.18%
- Less traffic from Twitter, at 5.97% compared to the all-niche average of 10.03%
- Much less traffic from Pinterest, YouTube and Pocket
The social media traffic profile of the “pure blogs” group (pictured below) is very close to that of the “top 15” group (not pictured).
On the other hand, the marketing “tool” sites (also not pictured) get much more traffic from YouTube, at 27.02% and much less from Facebook, at 42.22%.
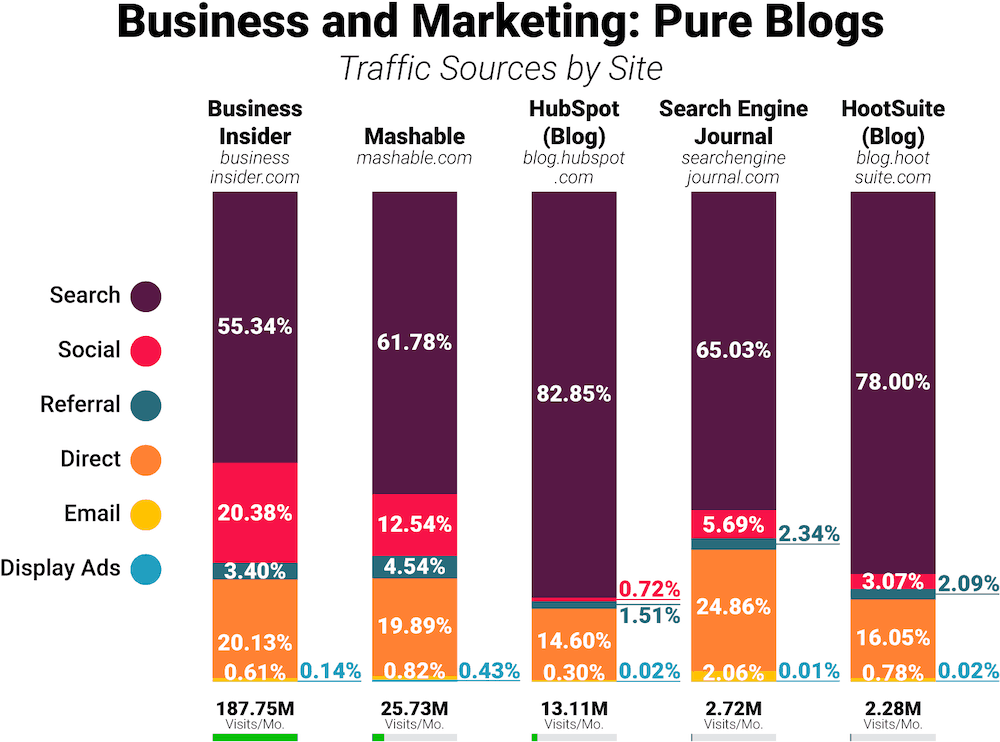
Traffic sources by site:
And here is the site-by-site breakdown for the “pure blogs” group.
Again, note that the data for HubSpot and HootSuite are for their blog subdomains only.
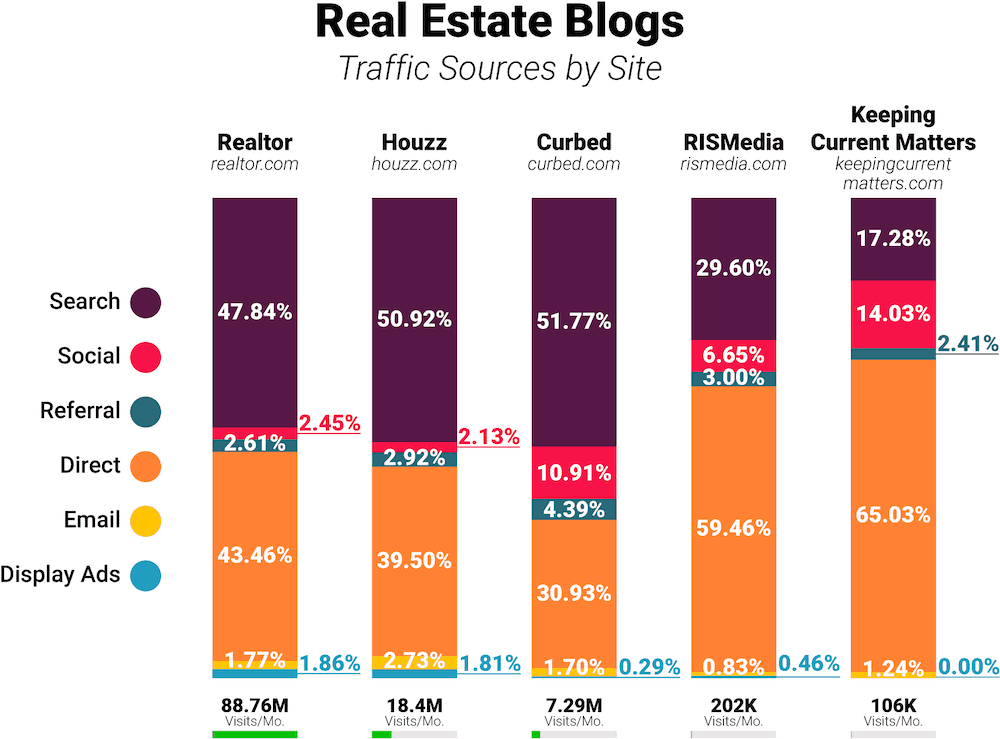
Real Estate Blogs

The data sample for the real estate niche includes Realtor.com, Houzz, Curbed, RISMedia, and Keeping Current Matters.
Combined, these five sites receive 115 million visits per month.
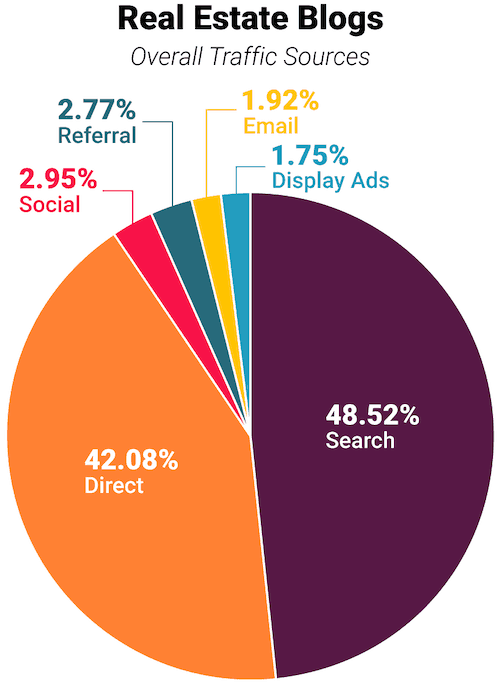
Overall traffic:
Real estate blogs tend to:
- Rely less on search traffic than average, getting 48.52% of their traffic from search (compared to the all-niche average of 60.68%)
- Also rely less on social media, getting 2.95% of their traffic from social networks (compared to the all-niche average of 6.44%)
- Rely much more on direct traffic than most niches (at 42.08%, compared to the all-niche average of 27.49%)
As I mentioned earlier, real estate has the highest percentage of direct traffic out of all the niches, at 42.08%.
This may mean that real estate is one of the least susceptible niches to algorithm changes or competition from Google or Facebook (even though Google still drives a large chunk of its traffic).
Real estate blogs also rely much more on advertising than most.
Of this niche’s search traffic, 97.52% is organic while 2.48% is paid. (For most niches, less than 0.10% is paid.)
And as you can see below, it also gets 1.75% of its traffic from display ads (compared to the all-niche average of 0.47%).
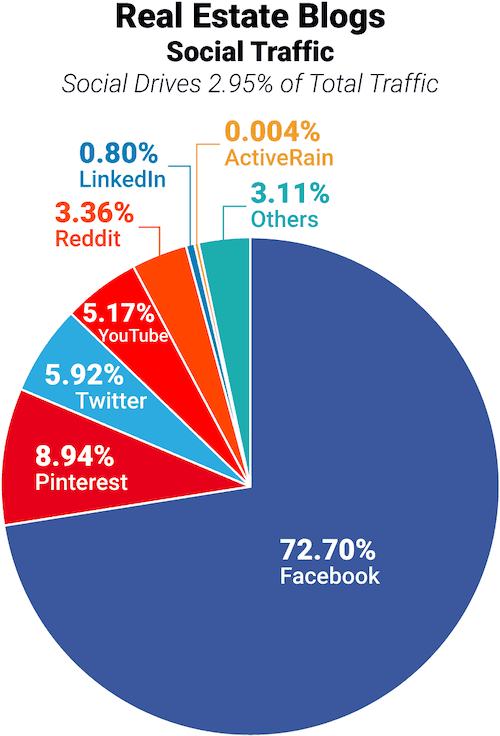
Social media traffic:
Real estate is another industry that gets a lot of traffic from Pinterest, at 8.94% of its social traffic (4x the all-niche average of 2.21%).
But Facebook is still by far the biggest driver of social traffic for real estate, at 72.70% (compared to the 65.36% all-niche average).
Traffic sources by site:
Here’s how the traffic breaks down by individual real estate blog:
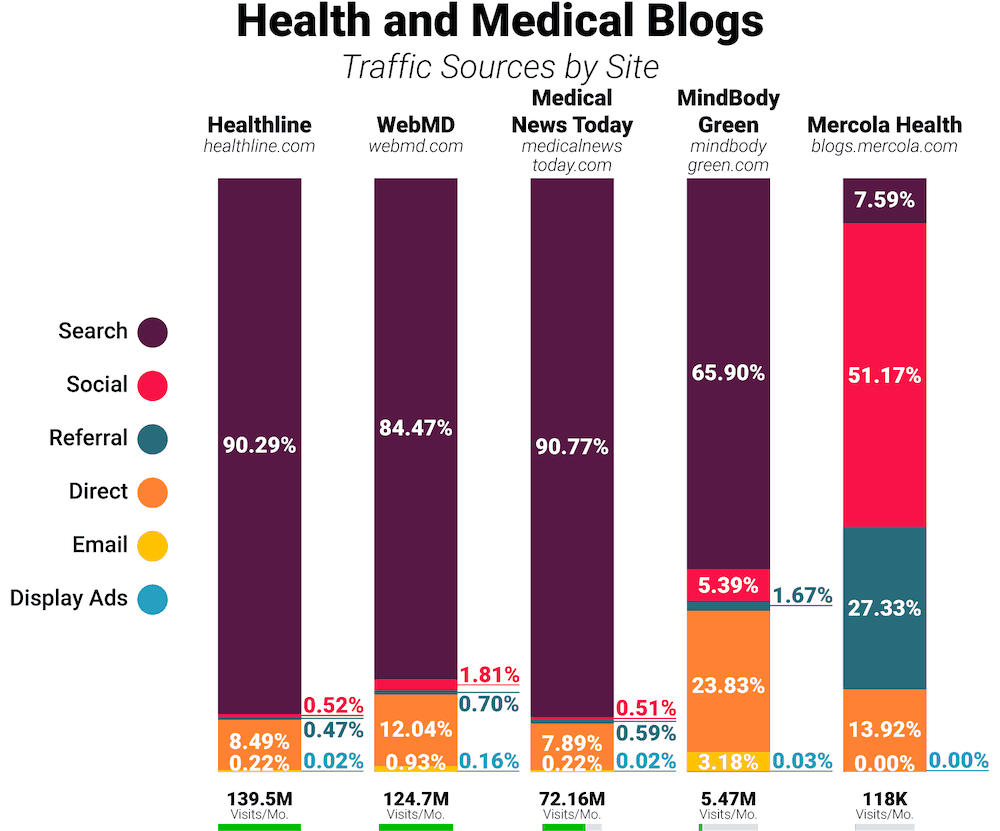
Health and Medical Blogs

The five health and medical sites I looked at were Healthline, WebMD, Medical News Today, MindBody Green and Mercola Health.
This group is enormous, with 342 million visits per month between those five sites.
That’s roughly the combined populations of the United States and Canada each visiting one of these five sites every month.
Google’s treatment of the health and medical niche has been interesting to watch lately.
From April 2018 to August 2019, Google hammered many high-profile health and medical sites, for reasons that are not completely clear (but may be due to placing more emphasis on scientific consensus).
But despite the large impact of those changes, search remains the largest source of traffic for this niche by a wide margin.
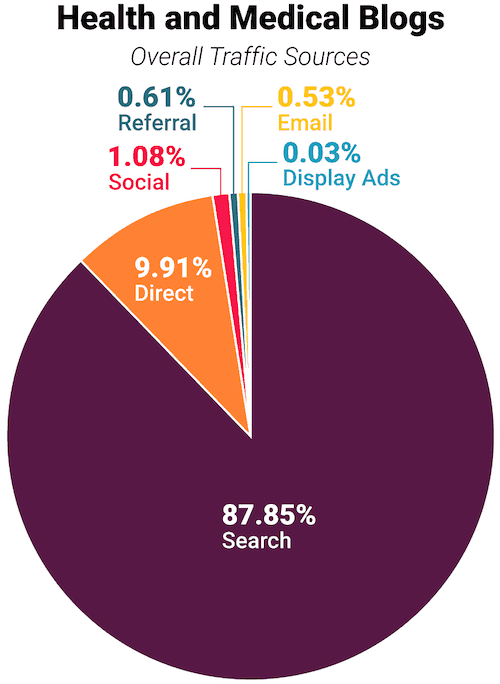
At 87.85% of its traffic, the health and medical niche is more reliant on search traffic than any other niche in this study.
Overall traffic:
Compared to the all-niche average, health and medical blogs are:
- Much more reliant on search traffic (87.85% vs. 60.68%)
- Much less reliant on direct (9.91% vs 27.49%), social (1.08% vs 6.44%), and referral traffic (0.61% vs 3.64%).
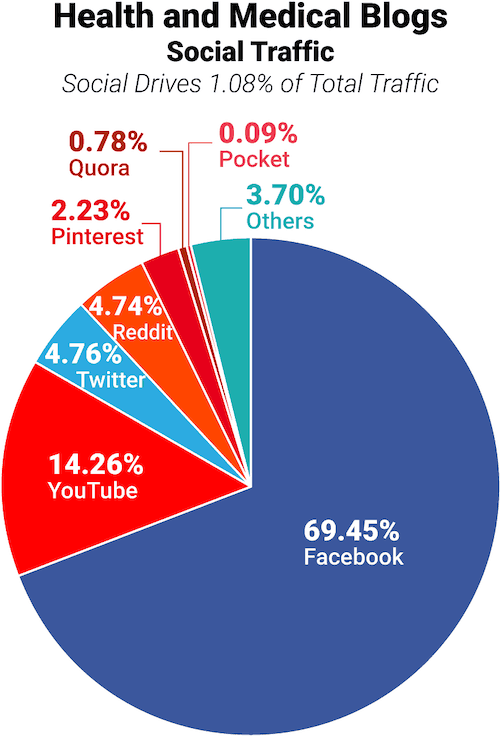
Social media traffic:
Although health and medical sites get less social traffic than any other niche in this study, one thing they have in common with sites in other niches is that most of their social traffic comes from Facebook.
On the other hand, they get much more of their social traffic from YouTube than the all-niche average (14.26% vs 2.66%).
They also get about half as much of their social traffic from Twitter and Reddit compared to the all-niche average.
Traffic sources by site:
As you can see below, the “blogs” subdomain of Mercola Health is a major outlier in the group, as well as in this study overall, since most sites get the majority of their traffic from search.
The overall Mercola domain as a whole (not included in the chart) has a traffic profile that is somewhat more similar to the others, but still different enough to call out (note: these figures are for August 2019):
- 5.9M visits/mo
- 30.73% search
- 6.16% social
- 1.11% referral
- 53.12% direct
- 8.86% email
- 0.01% display ads
Aside from Mercola, the other top sites in this niche have similar traffic sources:
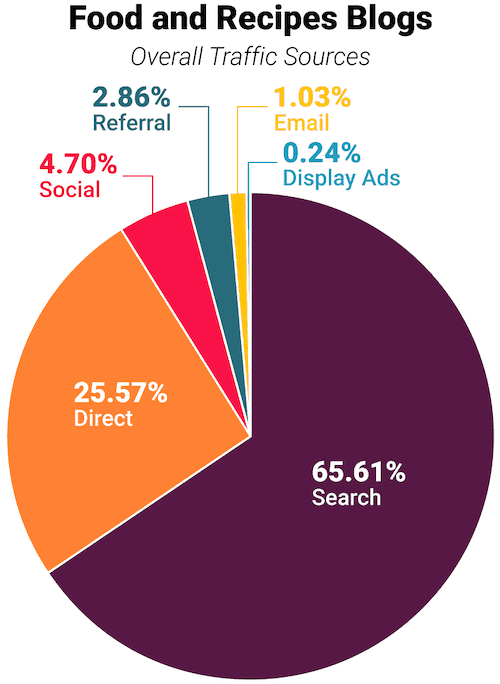
Food and Recipe Blogs

The five food and recipe blogs I studied were Kitchn, Serious Eats, Simply Recipes, Food52, and Minimalist Baker.
This basket of sites gets 41 million visits per month.
Overall traffic:
The food and recipe industry’s traffic sources are probably the most similar to the all-niche averages than any other industry in this study.
Compared to the all-niche average, food and recipe blogs are:
- Somewhat more reliant on search traffic (at 65.61% of their total vs. 60.68% for the all-niche average)
- Somewhat less reliant on all other traffic sources, including direct, social, referral, email and display ads.
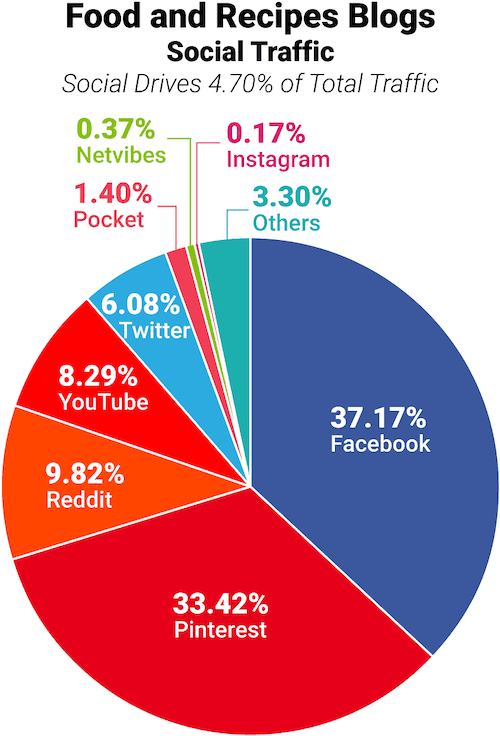
Social media traffic:
While the overall traffic picture for food and recipe blogs may be very similar to the all-niche averages, the social traffic breakdown is anything but.
Like most niches, Facebook is still the largest source of social traffic for food and recipe sites — but at 37.17%, it is much less important to food and recipes than it is for most niches (the all-niche average for Facebook is 65.36%).
On the other hand, Pinterest makes up a much bigger proportion of food and recipe blogs’ social traffic than usual, at 33.42% (compared to the all-niche average of 2.21%).
YouTube is another notable contributor, at 8.29% (more than triple the all-niche average).
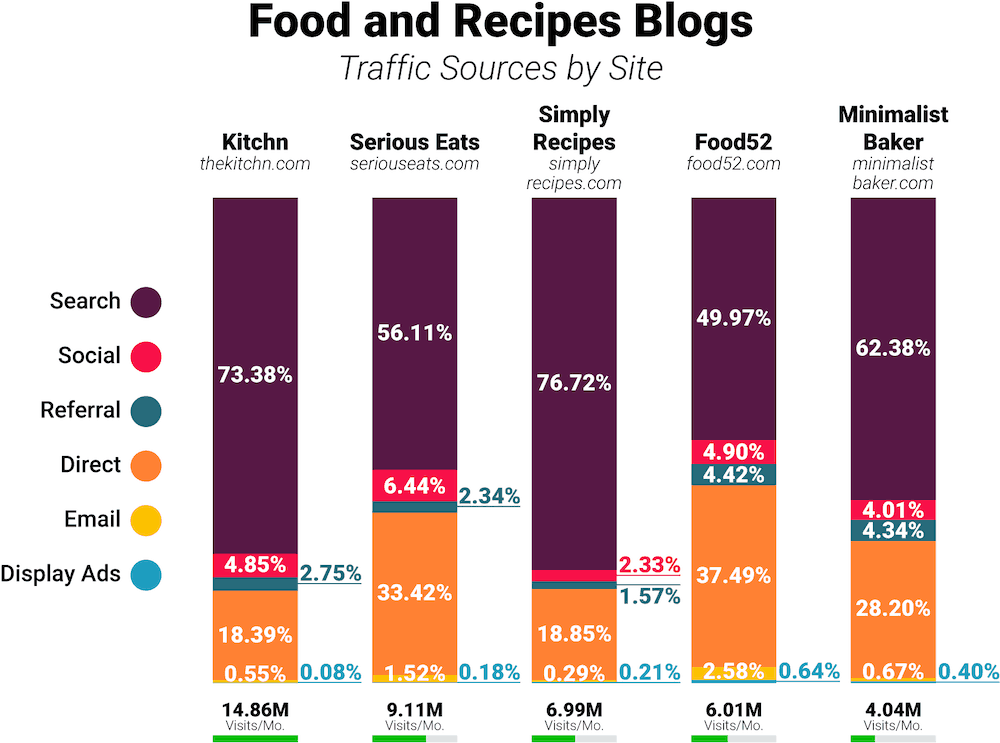
Traffic sources by site:
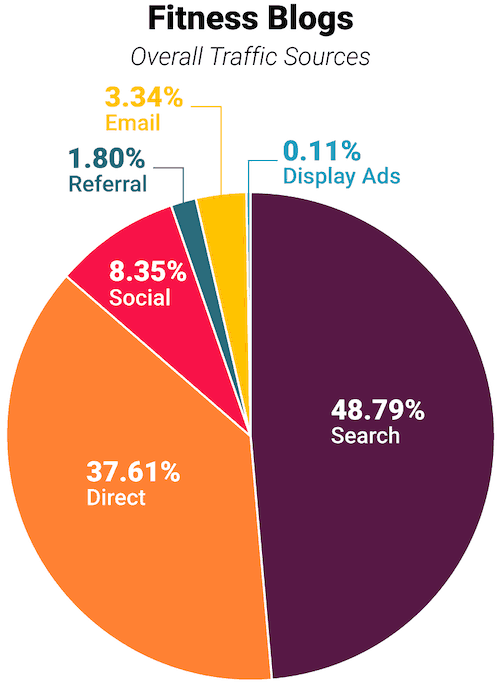
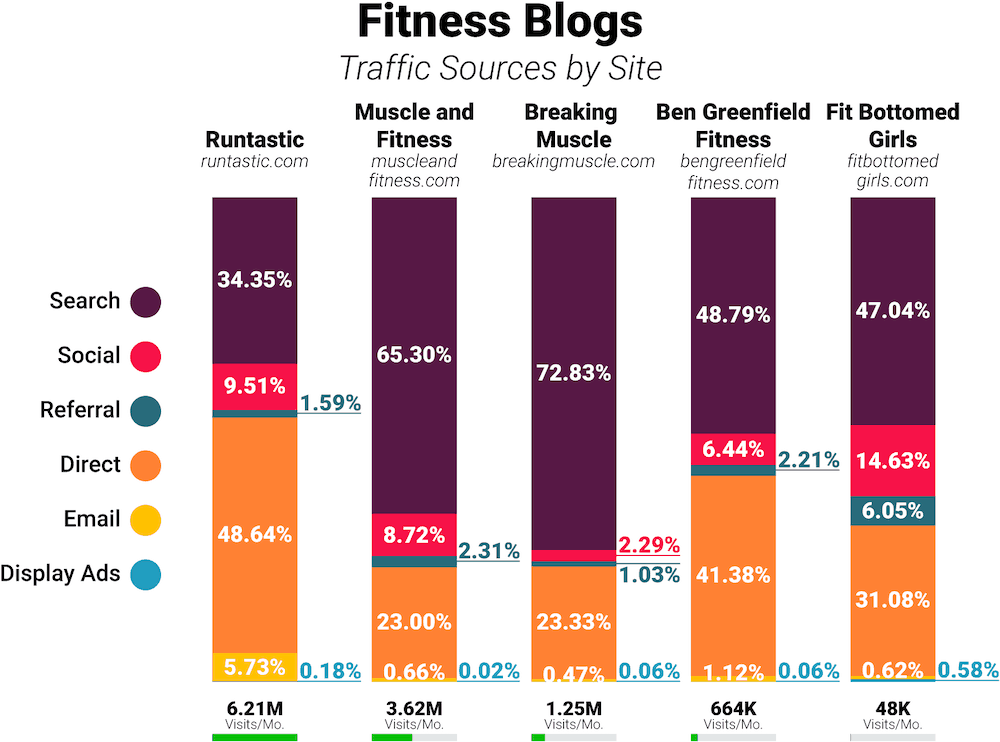
Fitness blogs

The five fitness blogs covered in this study were Runtastic, Muscle andFitness, Breaking Muscle, Ben Greenfield Fitness, and Fit Bottomed Girls.
Combined, these websites pull in 12 million visits per month.
Overall traffic:
Compared to the all-niche average, fitness blogs get:
- Less search traffic, at 48.79% of their total vs. 60.68% for the all-niche average
- More direct traffic, at 37.61% of their total vs. 27.49% for the all-niche average
- More social media traffic, at 8.35% of their total vs 6.44% for the all-niche average
- Half as much referral traffic and twice as much email traffic compared to the all-niche average
Social media traffic:
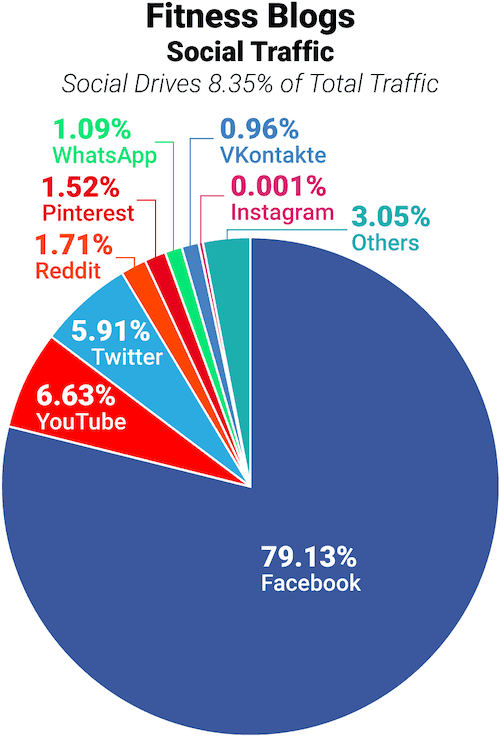
Fitness blogs rely more on Facebook than most other industries (79.13% for fitness vs. 65.36% on average).
They also get about 2.5x as much of their traffic from YouTube as the average.
I was so surprised by the low proportion of Instagram traffic (at 0.001%) that I included it in the chart below, even though with that small of a number it would normally be lumped in with “Others”.
Traffic sources by site:
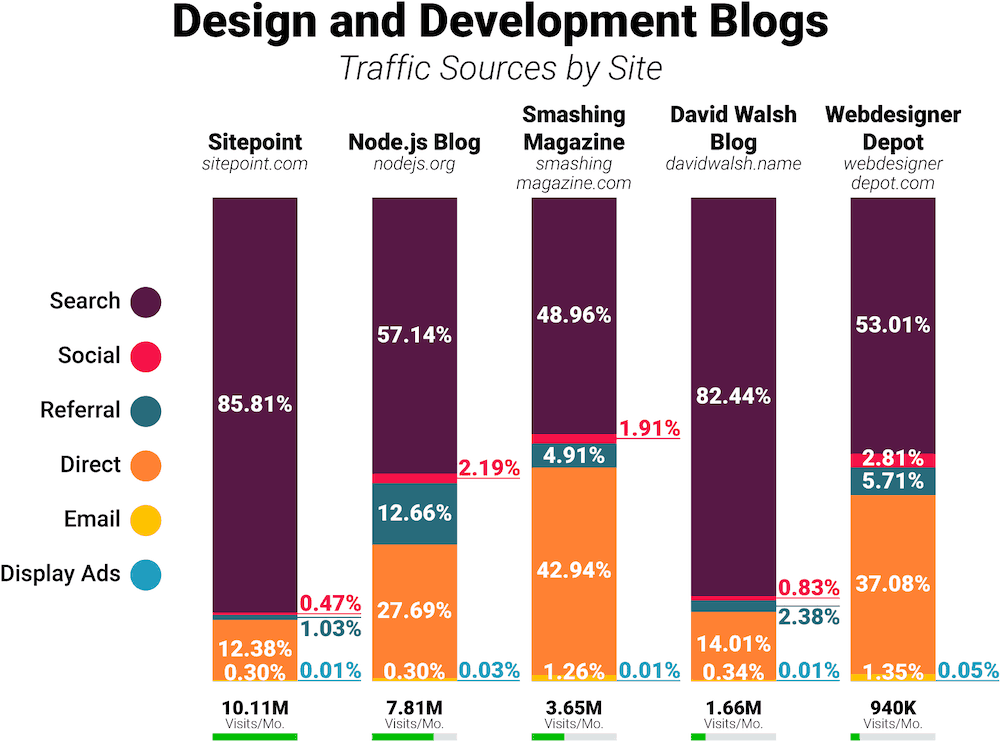
Design and Development Blogs

Design and development blogs covered in this study included Sitepoint, the Node.js Blog, Smashing Magazine, David Walsh Blog, and Webdesigner Depot.
These websites get 24 million visits per month, combined.
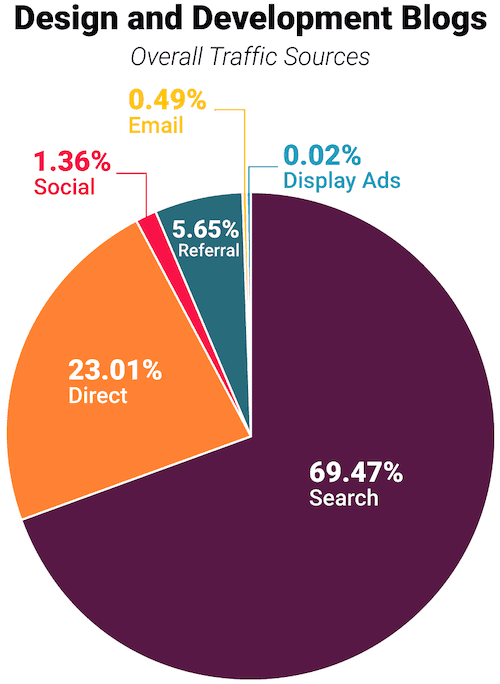
Overall traffic:
Compared to all-niche averages, design and development blogs get:
- More search traffic, at 69.47% of their total traffic (vs. 60.68% for the all-niche average)
- Somewhat less direct traffic, at 23.01% of their total traffic (vs. 27.49% for the all-niche average)
- Much less social media traffic, at 1.36% of their total (vs 6.44% for the all-niche average) — less than every other niche in this study except health and medical
- More referral traffic from other sites, at 5.65% of their total (vs. 3.64% for the all-niche average)
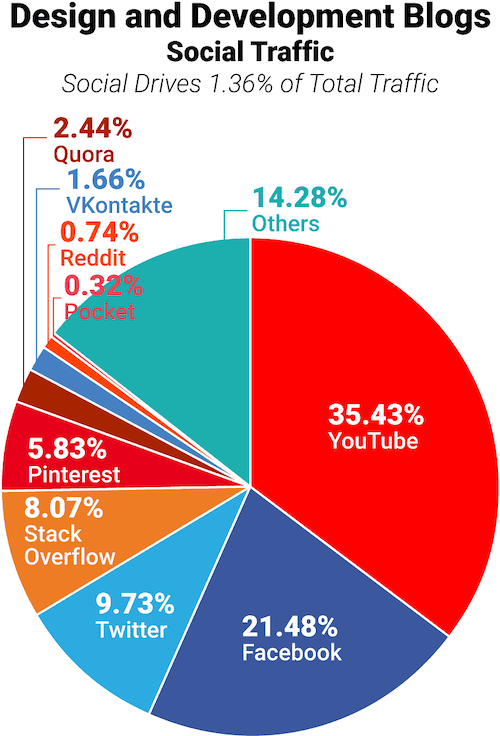
Social media traffic:
Design and development is one of only 2 niches in this study for which Facebook is not the top social media source (the other is crypto). At 21.48%, Facebook’s contribution to this niche’s social media traffic is about 1/3 of the all-niche average.
Factor in the fact that only 1.36% of design and development blogs’ overall traffic is driven by social media, and it’s easily the industry that is least reliant on Facebook.
However, YouTube makes up a much bigger proportion of its social media traffic than average, at 35.43% (compared to the 2.66% all-niche average).
Stack Overflow is a unique and significant contributor as well, at 8.07% of this niche’s social traffic.
Traffic sources by site:
Here are the traffic details for each individual design and development blog:
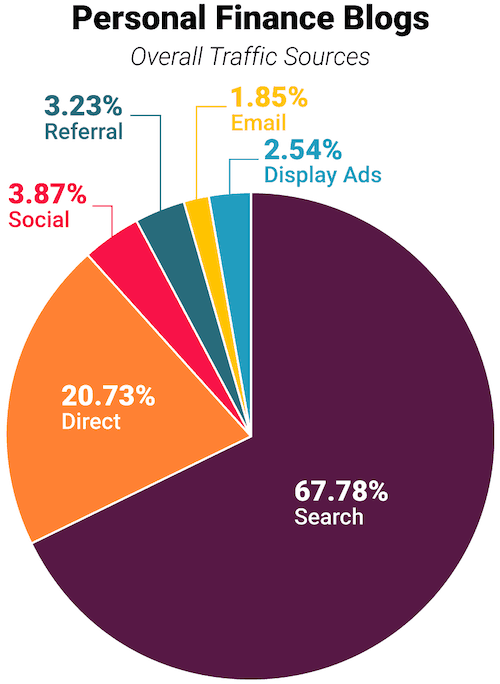
Personal Finance Blogs

The personal finance niche is represented by Money Under 30, Wise Bread, Financial Samurai, A Wealth of Common Sense, and Of Dollars and Data.
Together, they get a little over 6 million visits per month.
Overall traffic:
Sites in the personal finance niche tend to:
- Rely more on Google than average, with 67.78% of their traffic coming from search (vs. the all-niche average of 60.68%).
- Get less direct traffic than average, at 20.73% of their total traffic (vs. 27.49% for all niches).
- Get less social media traffic than average, at 3.87% of their total traffic (vs 6.44% for all niches).
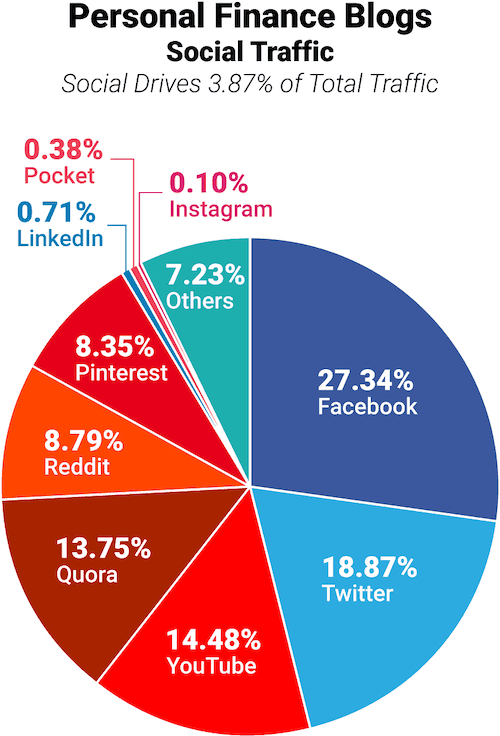
Social media traffic:
Social traffic to personal finance blogs is much more evenly distributed among the top handful of social networks than is the case for most niches — the pie chart below almost looks like actual pie slices.
Compared to all-niche averages, personal finance blogs get:
- Much less of their social traffic from Facebook, at 27.34% (compared to the all-niche average of 65.36%).
- Almost twice as much of their social traffic from Twitter, at 18.87% (compared to the all-niche average of 10.03%).
- Much more traffic from YouTube, Quora, and Pinterest.
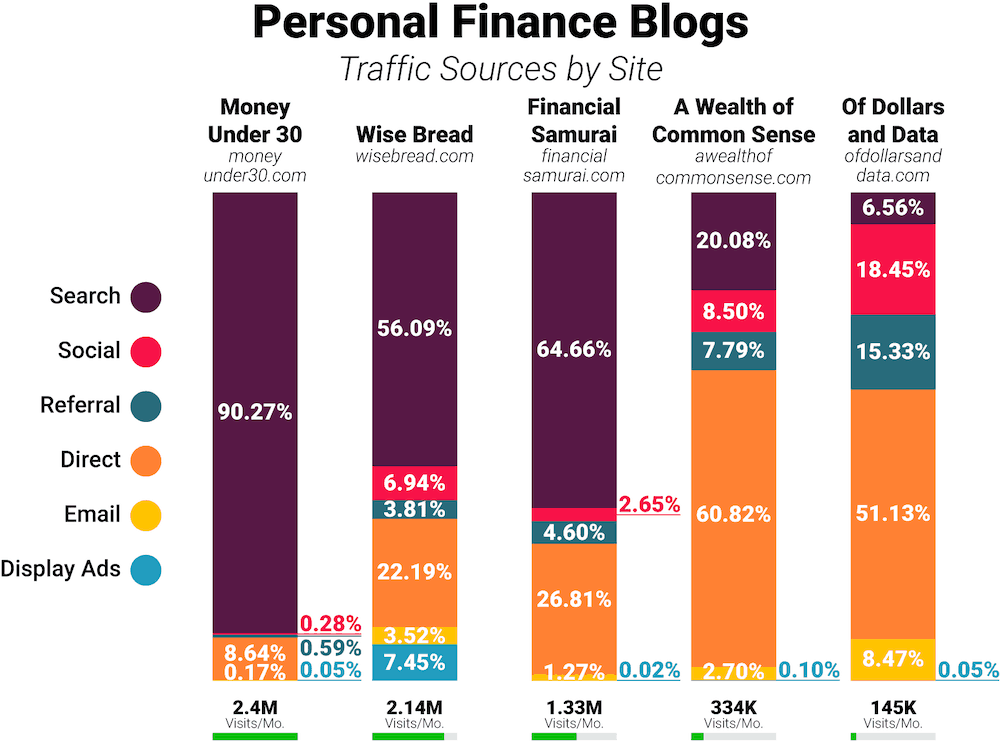
Traffic sources by site:
Photography Blogs
The photography blogs covered here receive a combined 34 million visits per month: Digital Photography Review, PetaPixel, Fstoppers, Digital Photography School, and The Phoblographer.
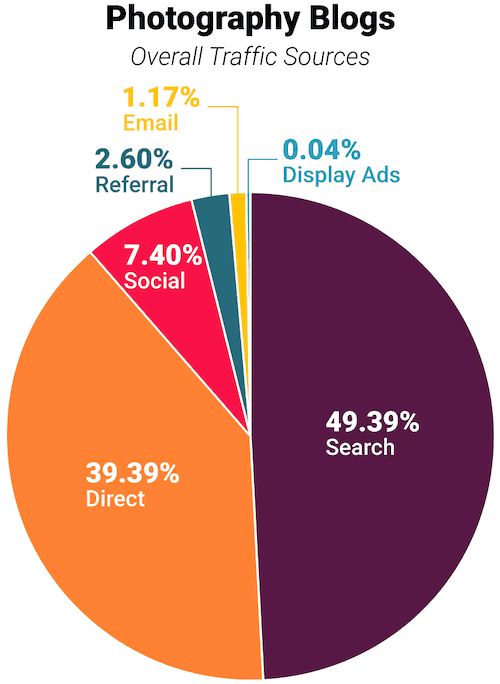
Overall traffic:
Blogs in the photography niche tend to:
- Get less traffic from Google than average, with 49.39% of their traffic coming from search (vs. the all-niche average of 60.68%).
- Get more direct traffic than average, at 39.39% of their total traffic (vs. 27.49% for all niches).
- Get slightly more social media traffic than average, at 7.40% of their total traffic (vs 6.44% for all niches).
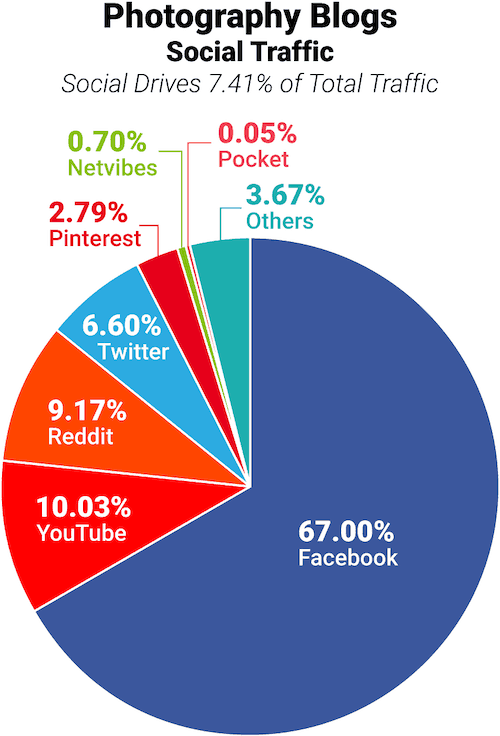
Social media traffic:
Photography blogs get about the same amount of traffic from Facebook and Reddit as other niches.
But photography blogs also get:
- Nearly 4x as much YouTube traffic, at 10.03% (compared to the all-niche average of 2.66%).
- Less Twitter traffic, at 6.60% (compared to the all-niche average of 10.03%)
- More Pinterest traffic, at 2.79% (compared to the all-niche average of 2.21%)
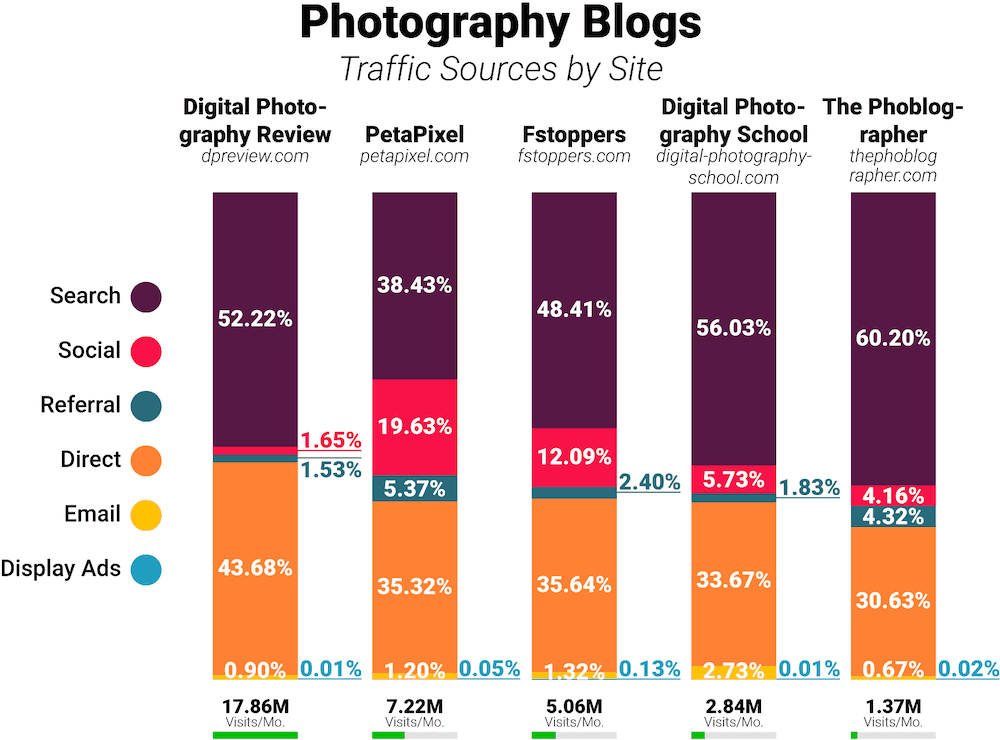
Traffic sources by site:
Travel Blogs
The travel niche is represented by the following blogs and sites: Lonely Planet, The Points Guy, Nomadic Matt, View From the Wing, and Adventure Journal.
Combined, they get about 25 million visits per month.
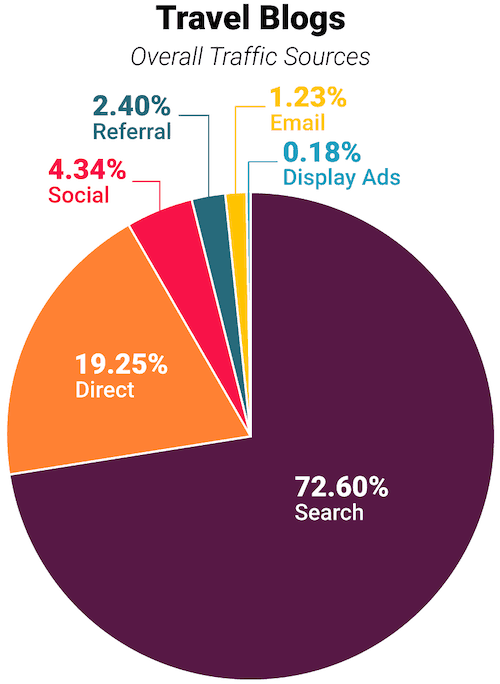
Overall traffic:
Sites in the travel niche typically:
- Get more traffic from Google than sites in other niches, with 72.60% of their traffic coming from search (vs. the all-niche average of 60.68%).
- Get less direct traffic than sites in other niches, at 19.25% of their total traffic (vs. 27.49% for all niches).
- Get less social media traffic than sites in other niches, at 4.34% of their total traffic (vs 6.44% for all niches).
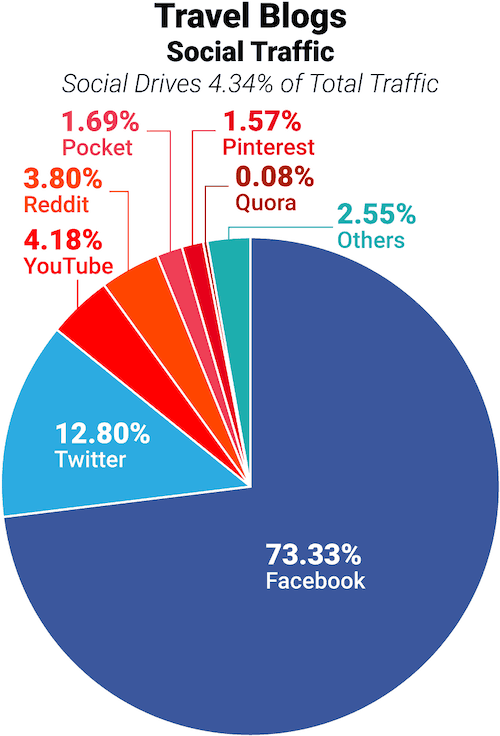
Social media traffic:
Here’s how travel blogs compare to all-niche averages in terms of traffic from social networks:
- Facebook and Twitter: slightly above average, at 73.33% and 12.80%, respectively (compared to the all-niche averages of 65.36% and 10.03%, respectively).
- YouTube and Pocket: significantly above average, at 4.18% for YouTube (compared to the all-niche average of 2.66%) and 1.69% for Pocket (compared to the all-niche average of 0.71%)
- Reddit and Pinterest: significantly below average, at 3.80% for Reddit (compared to the average of 8.95%) and 1.57% for Pinterest (compared to the average of 2.21%)
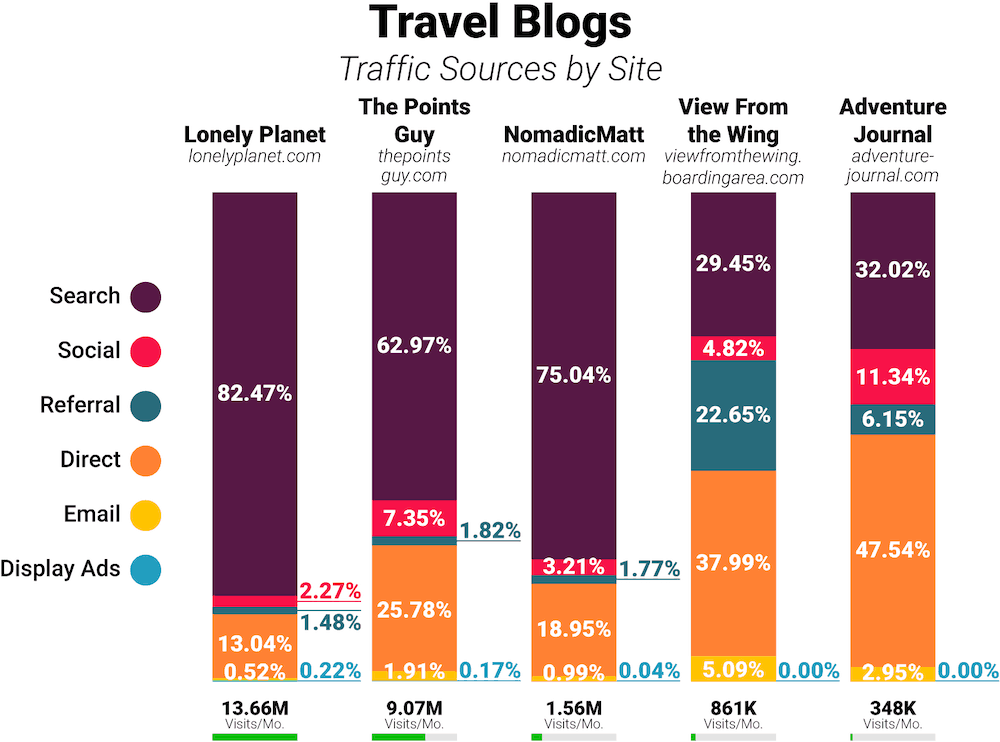
Traffic sources by site:
Cryptocurrency Blogs

I was tempted to include cryptocurrency in the finance or tech category of this online traffic study.
Then I saw the volume some of these sites get:
At over 8 million visits per month, CoinDesk alone is more than three times as popular as any personal finance blog.
Combined, the five sites in this study — CoinDesk, News BTC, Bitcoin News (subdomain), The Coinbase Blog (subdomain), and Coinspeaker — receive 13 million visits per month as of this writing.
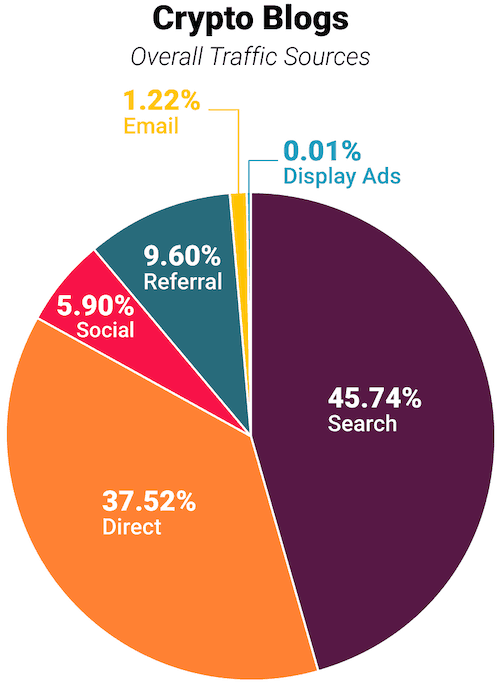
Overall traffic:
Compared to sites in other niches, sites in the cryptocurrency niche typically:
- Get much less traffic from Google, with only 45.74% of their traffic coming from search (vs. the all-niche average of 60.68%). This is one of the few niches that gets less than half its traffic from search.
- Get much more direct traffic, at 37.52% of their total traffic (vs. 27.49% for all niches).
- Get much more referral traffic, at 9.60% of their total traffic (vs 3.64% for all niches).
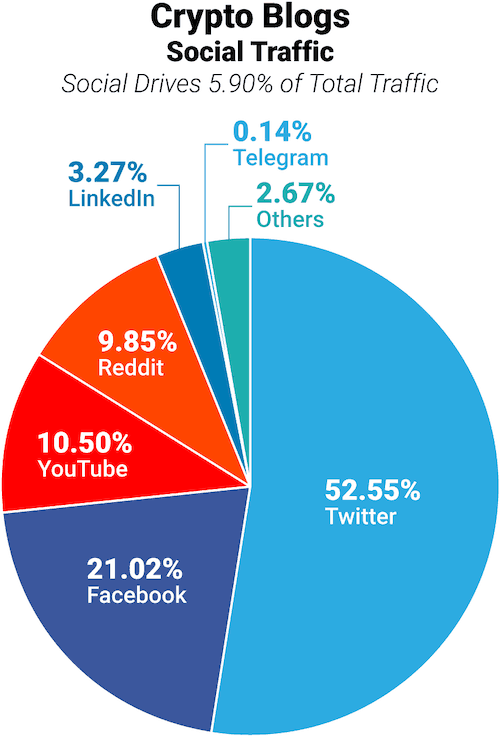
Social media traffic:
Along with design and development, crypto is one of only two niches in this study whose #1 social traffic source is not Facebook. At only 21.02% of its social traffic, Facebook brings in about a third as much traffic for crypto as it does for the average niche.
And Crypto is the only niche for which Twitter is the biggest social network, at 52.55% of its social traffic — 5x the all-niche average.
YouTube is also a much bigger contributor to this niche than it is to most, at 10.50% (vs. the all-niche average of 2.66%).
And this is the only niche for which the encrypted messaging app Telegram is a top-6 social media contributor.
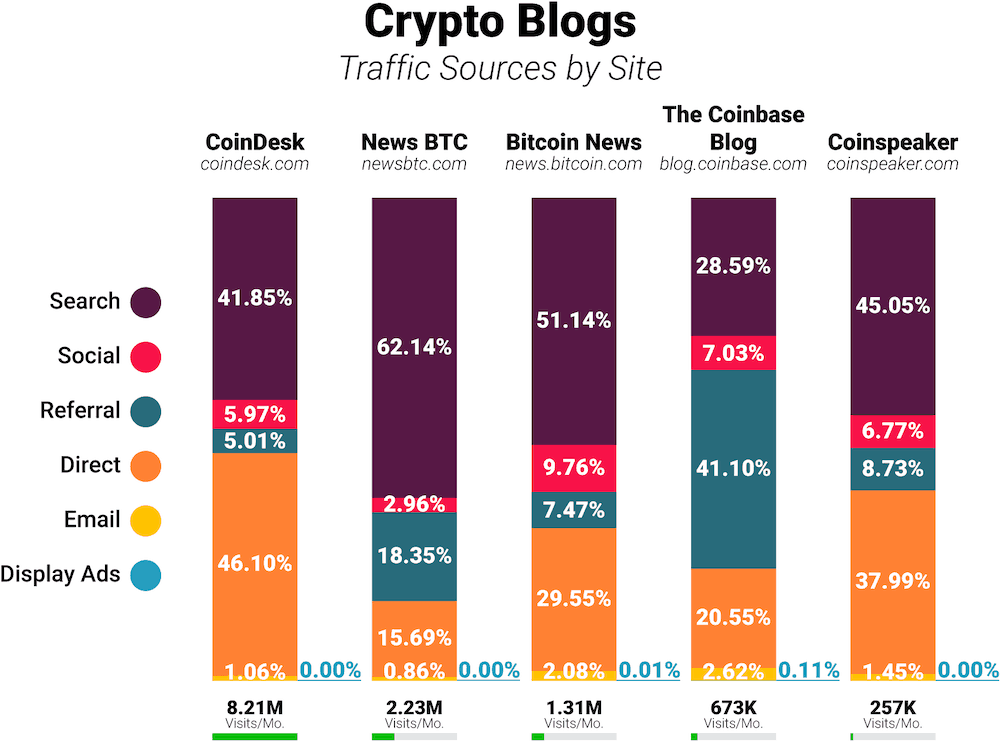
Traffic sources by site:
Note: the Coinbase Blog subdomain gets most of its “referral” traffic from its parent site.
Study Method and Conclusion
This research was conducted in August and September 2019, based on 3.252 billion visits to English-language websites across the months of May, June, and July 2019.
The data source was SimilarWeb, whose worldwide data-collection methods can be found here.
Special thanks to Detailed.com for providing lists of top blogs, which greatly aided with website selection for this study.
And I’d love to hear your thoughts.
What did you think of this research?
Did anything in particular jump out at you?
Do you have any questions?
Leave a comment below to let me know.
You can also download this full report for future reference by clicking here.
Super interesting study, Kyle! The stat that jumped out to me was that Google sends 8x more traffic than all social media combined. It didn’t necessarily surprise me. But it was interesting to see just how much traffic Google sends vs. FB, Twitter etc.